Databricks Chargeback
The Databricks Chargeback feature allows administrators to create logical groupings of Databricks resources, known as Cost Centers, so that you can track and analyze costs for specific projects, departments, or other user-defined categories. With Chargeback, you gain clear insights into resource consumption and associated expenses, empowering your organization to allocate costs efficiently and promote responsible usage of Databricks resources.
Prerequisites
- At least one Data Source configured within the system.
- Refer to Role and Access Management for more information on access control.
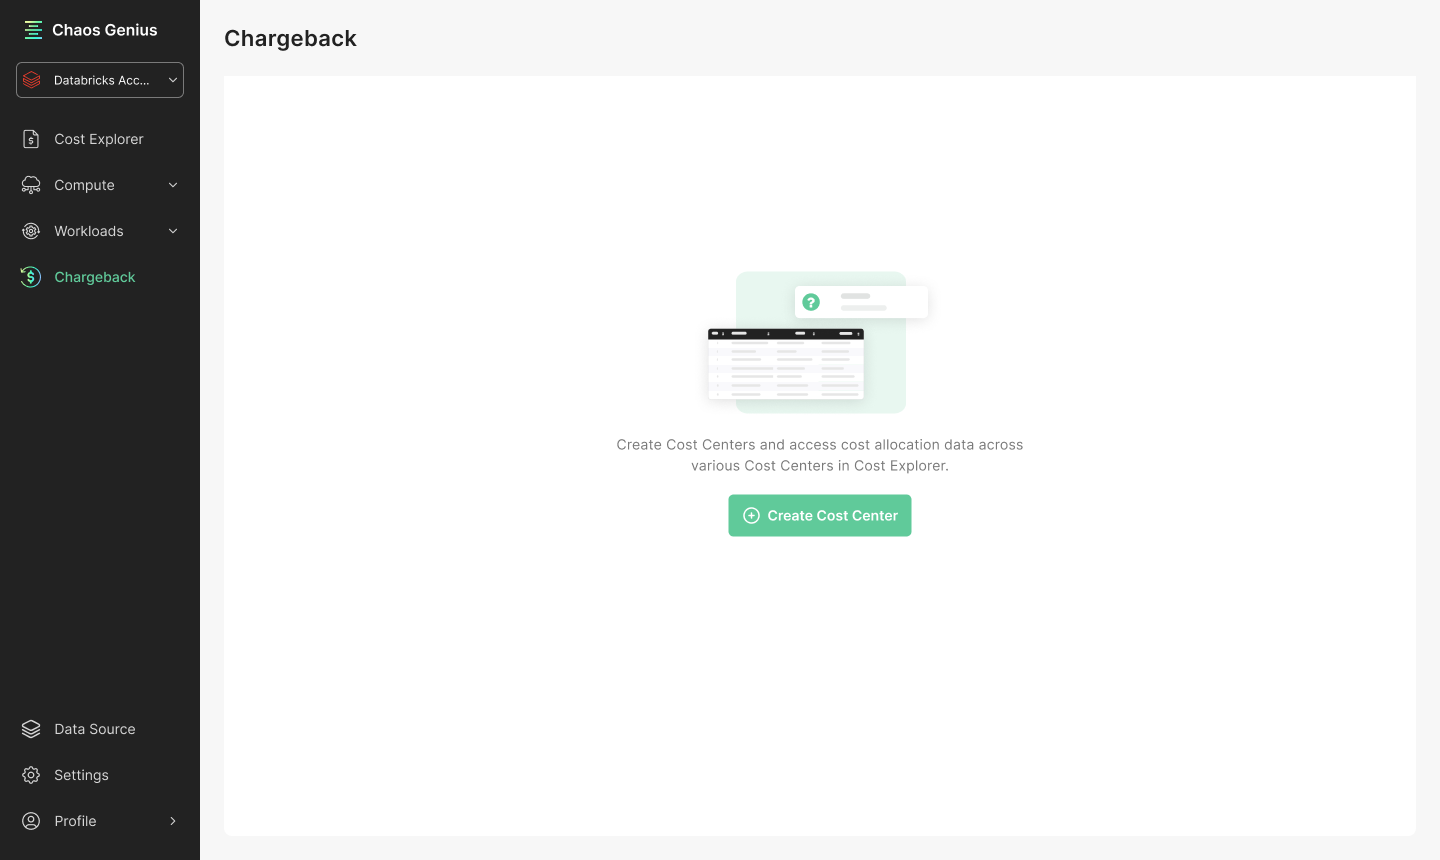
Accessing the Chargeback Feature
-
Navigation:
From the main dashboard, click on the Chargeback option in the left-hand menu. -
Dashboard Overview:
Upon accessing the Chargeback section, you can view a list of existing Cost Centers and key information about each Cost Center. This view helps you monitor current configurations and quickly access reporting details.
Creating a Cost Center
The process to create a Cost Center is divided into three main steps:
Step 1: Access the Cost Center Creation
- Click on the Create Cost Center button found in the Chargeback section.
- A modal window will appear with two main sections:
- Update Details: Enter the unique Cost Center name and the Owner Name.
- Select Resources: Define the resources for this Cost Center using our query builder.
Step 2: Defining Resources
In this step, you will select and configure the Databricks resources that will contribute to the Cost Center.
Defining Resources: Adding Groups and Conditions
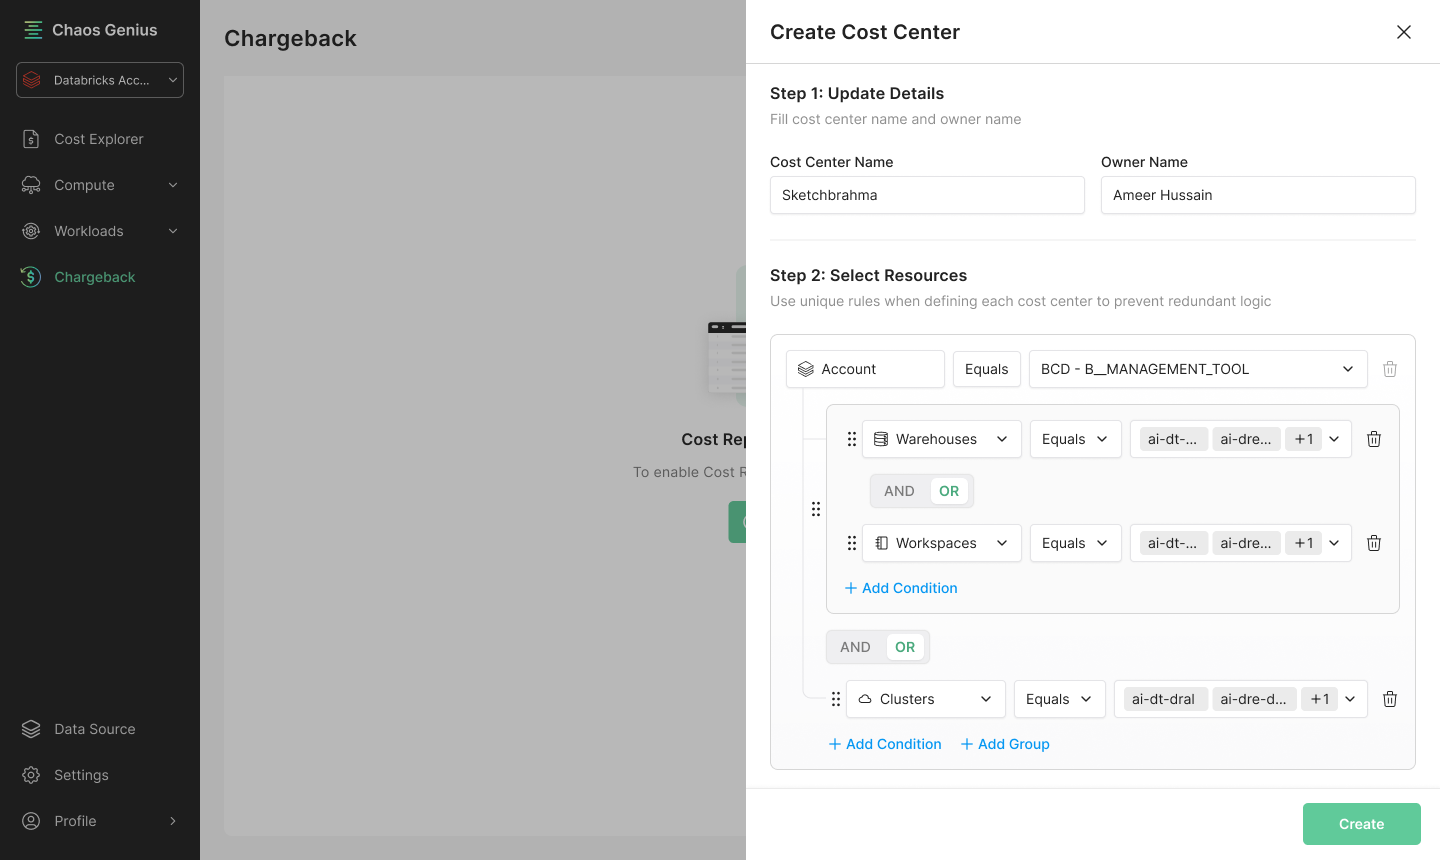
When creating a cost center, you define which Databricks resources to include using a query builder. This builder lets you build logical expressions by adding individual conditions and grouping them together. The two key actions you can take are to Add Condition and Add Group.
Add Condition
The Add Condition button allows you to insert a filtering rule. Each condition specifies:
- Resource Type: Choose from available resources (e.g., Warehouses, Workspaces, Clusters, Tags, SKUs).
- Operator: Select how the resource attribute is matched (options include Equals, Contains, Starts With, Ends With).
- Resource Value: Enter the specific identifier or keyword that the operator will target.
How It Works:
- Insertion: Clicking the Add Condition button inserts a new row in the current group (or the main query area if no group is active).
- Real-Time Validation: As you define the condition, the system checks for:
- Empty Inputs: Required fields must be populated; otherwise, an error message (such as "The field cannot be empty") appears.
- Duplicates: If a condition identical to one already present in the main query area is added, an error message (such as "Duplicate Condition Detected!") appears.
- Logical Combinations: Once created, you can join multiple conditions within a group using the logical operators (AND/OR). The order of conditions is significant and can be adjusted using drag and drop. For example, if you have three conditions, Workspace AND Cluster OR Tag, the condition will be applied as (Workspace AND Cluster) OR Tag. If you want Workspace OR (Cluster AND Tag), you can add with the condition Workspace, and then add the group with (Cluster AND Tag).
Add Group
The Add Group button creates a nested container within your query that allows you to combine multiple conditions under a single logical unit. This is especially useful when you need to apply complex logic that involves mixed operators (e.g., grouping several conditions together before combining them with other standalone rules).
How It Works:
- Group Creation: When you click Add Group, a new container appears within the query builder. This container is visually distinct and can hold one or more conditions.
- Nesting Limit: To keep the query straightforward, groups support only a single level of nesting. This means you cannot create sub-groups within an already created group.
- Adding Conditions to a Group: Once a group is created, you can click Add Condition inside the group to add rules that belong to that logical unit.
- Drag and Drop: You can reorder entire groups or individual conditions by dragging them. Adjusting the order changes the evaluation precedence in your overall query.
- Validation:
- Deduplication: The system performs checking at the group level too. If an identical set of conditions exists in another group, you will receive an error notification about duplicate logic.
Using groups helps organize your conditions into manageable blocks. This not only improves the clarity and readability of your logic but also ensures that complex logical operations are structured and processed correctly.
-
Resource Types:
Choose from available Databricks resources such as:- Warehouses
- Workspaces
- Clusters
- Tags
- SKUs
-
Condition Operators:
Define how the resource attributes are matched using operators such as:- Equals
- Contains
- Starts With
- Ends With
Step 3: Reviewing and Creating
Once all conditions are correctly defined and validated, review the Cost Center details and click Create. A success message will display, confirming that the Cost Center has been created. Note that it can take up to 24 hours for the cost data associated with the new Cost Center to refresh and appear in the Cost Explorer.
Managing Cost Centers
After creation, you can manage your Cost Centers through the Chargeback interface.
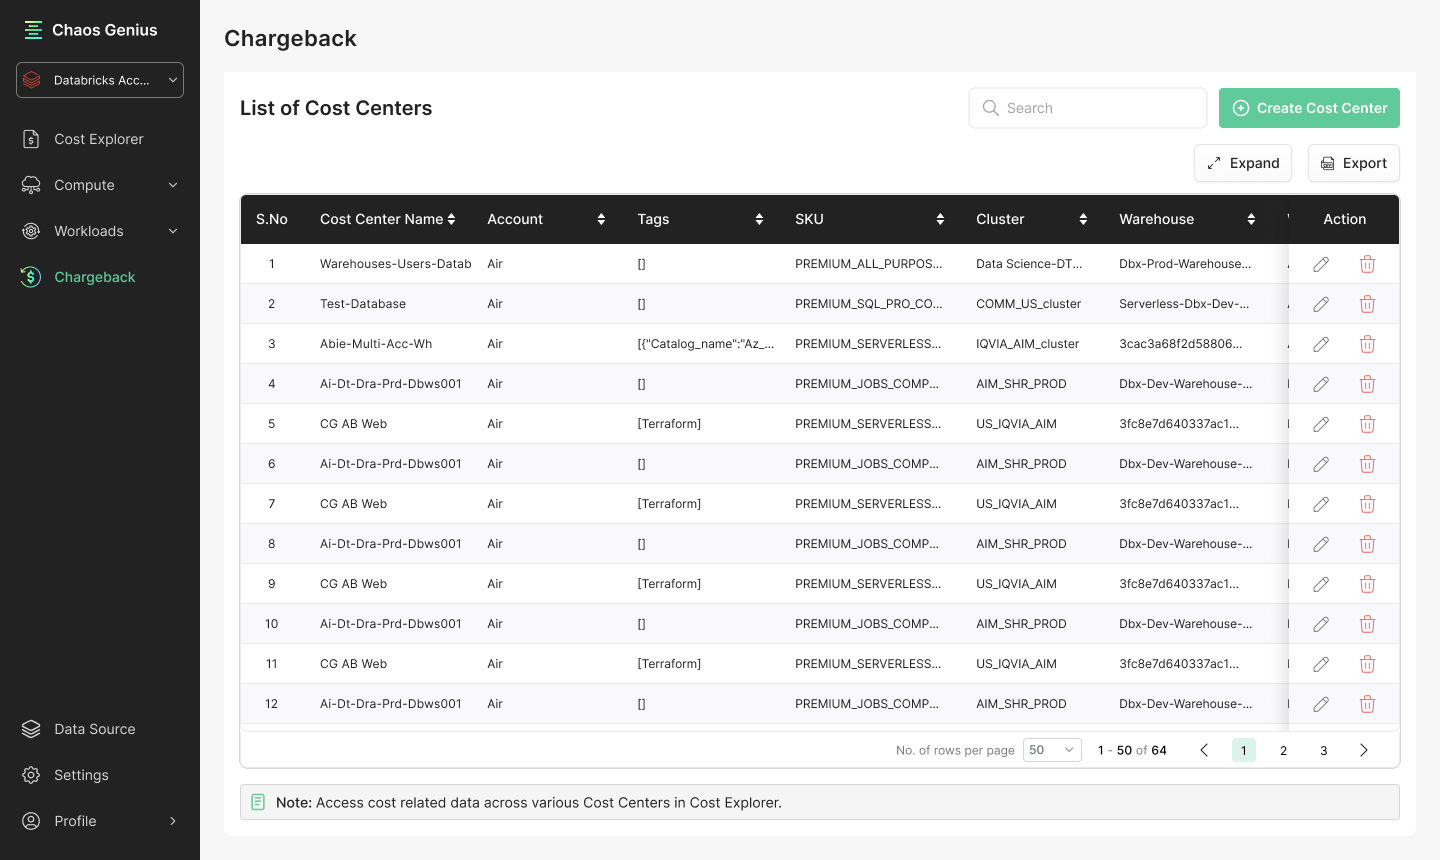
List View
- Overview:
The list view presents a comprehensive table of all configured Cost Centers. Each entry includes:- Cost Center Name
- Configured Resources (displayed as a summary)
- Owner
- Status (such as "In Progress" or "Live")
- Actions:
From the list view, you can:- Edit: Modify Cost Center details or resource configurations.
- Delete: Remove a Cost Center that is no longer needed.
- Export: Download Cost Center data in CSV format for offline review.
Note: It takes up to 24 hours for the cost data associated with the edited Cost Center to refresh and appear in the Cost Explorer.
Cost Reporting and Visualization
The Cost Explorer provides comprehensive visualization to help you analyze your Databricks costs across Cost Centers. You can:
- Filter and Group: Easily filter by Cost Center or group data by Cost Center to focus on specific departments or projects
- Customize Views: Apply additional filters for workspaces and date ranges to refine your analysis
- Choose Time Granularity: View costs in daily, weekly, or monthly increments based on your reporting needs
- Set Display Preferences: Select Cost ($) or Databricks Units (DBUs) as per your preference
- Interact with Data: Explore costs through interactive charts, download reports as CSV files, or review detailed information in table format
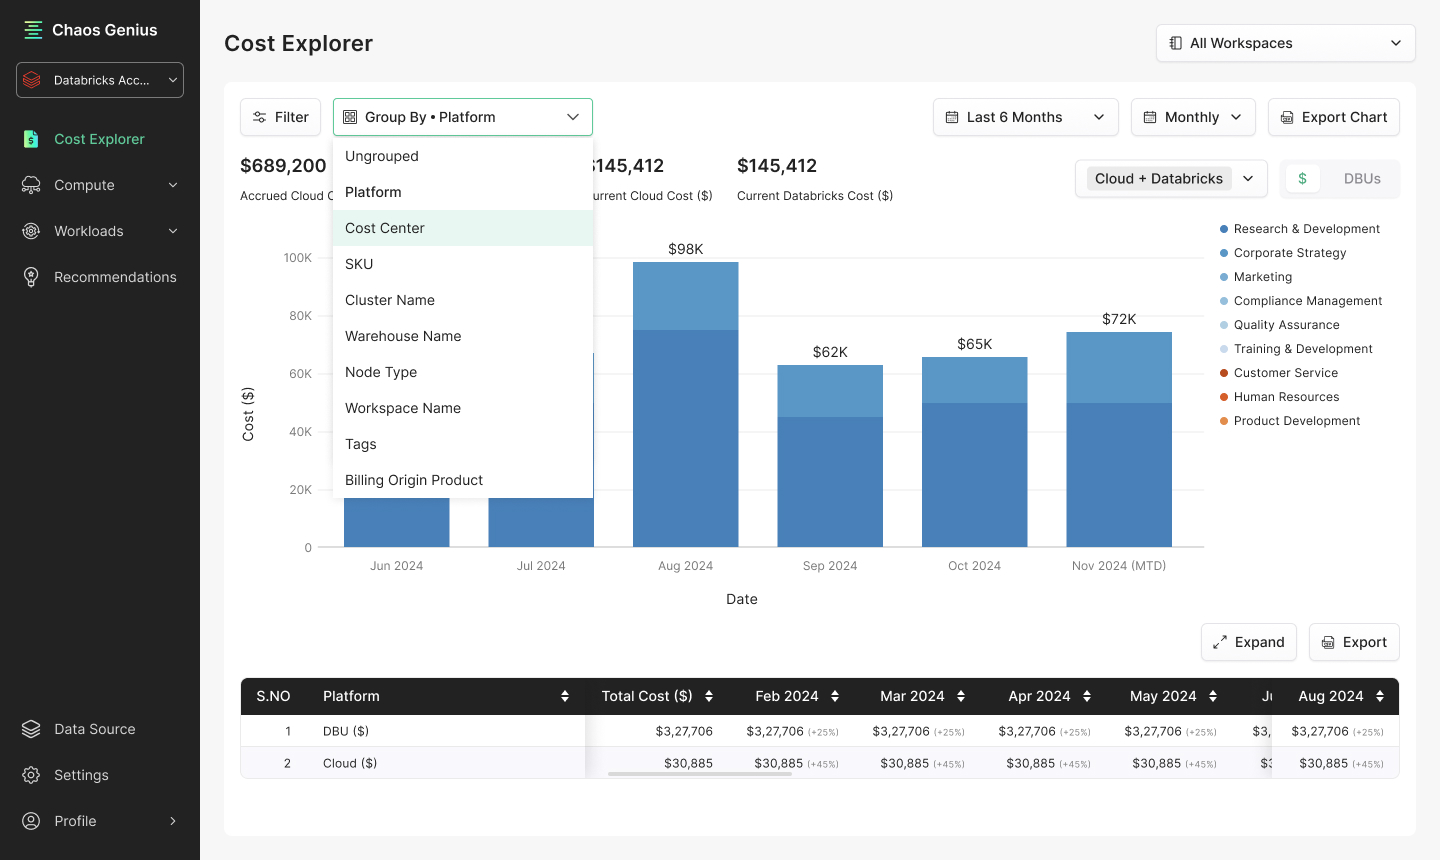
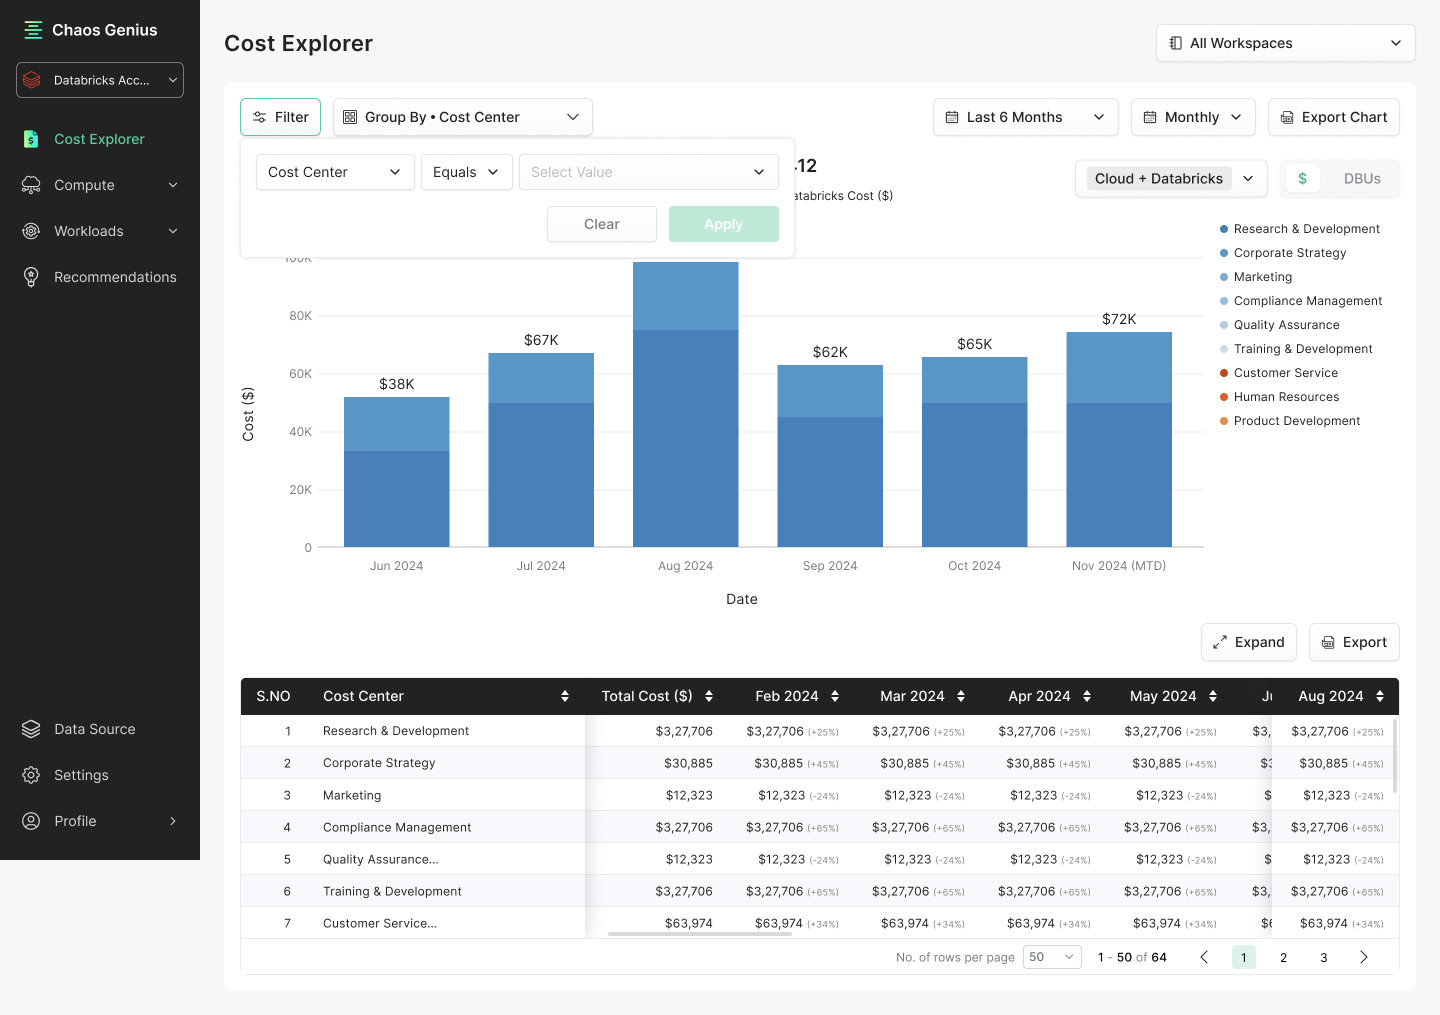
These features enable you to gain actionable insights into your Databricks spending patterns and make informed resource allocation decisions.
Access Control and Permissions
-
Administrator Access:
Only administrators are permitted to create, modify, or delete Cost Centers. This restricts configuration capabilities to ensure proper governance of cost allocations. -
User Access:
Both administrators and regular users can access and view chargeback reports. This promotes transparency and shared accountability across teams.
Practical Examples
To help you better understand how to implement the Databricks Chargeback feature effectively, here are some real-world examples:
Example 1: Department-Based Cost Center
Scenario: You want to track all Databricks costs associated with your Marketing department.
Cost Center Configuration:
- Name: Marketing Department
- Owner: Jane Smith (Marketing Director)
- Resource Definition:
- Condition 1: Tags Contains "department:marketing"
- Condition 2: Tags Contains "PrimaryOwner:jane-smith"
- Formula with the AND/OR operators: (Condition_1 AND Condition_2)
Benefits: This configuration captures all resources explicitly tagged for marketing as well as any resources in workspaces with "marketing" in their name. The Marketing Director can now track all Databricks expenses for their department and identify cost-saving opportunities.
Example 2: Project-Based Cost Center with Complex Logic
Scenario: You need to track costs for a machine learning project that spans multiple teams but excludes development environments.
Cost Center Configuration:
- Name: ML Customer Churn Project
- Owner: Alex Johnson (Project Manager)
- Resource Definition:
- Condition 1: Tags Equals "project:customer-churn"
- Group 1:
- Condition 2: Clusters Contains "ml-churn"
- Condition 3: Warehouses Starts With "churn_analysis"
- Condition 4: Tags Equals "environment:production"
- Formula with the AND/OR operators: (Condition_1) AND (Condition_2 OR Condition_3 AND Condition_4)
Benefits: This more complex configuration ensures that only production ML resources for the customer churn project are included in the cost center. By specifically targeting resources tagged with "environment:production", development resources are excluded, providing an accurate view of production costs.
Example 3: Cross-Functional Analytics Platform
Scenario: Your organization has a central analytics platform used by multiple departments, and you want to allocate costs proportionally.
Cost Center Configuration:
- Name: Enterprise Analytics Platform
- Owner: Chris Lee (Data Platform Lead)
- Resource Definition:
- Condition 1: Warehouses Equals "enterprise_analytics"
- Condition 2: SKUs Contains "SQL"
- Condition 3: Clusters Contains "analytics-shared"
- Formula with the AND/OR operators: (Condition_1 AND Condition_2) OR Condition_3
Benefits: This configuration allows the Data Platform team to track all costs associated with the shared analytics infrastructure. These costs can then be reported to leadership and potentially allocated to departments based on usage metrics.
Best Practices from These Examples
- Use Consistent Tagging: As shown in Example 1, a consistent tagging strategy makes cost allocation more accurate.
- Combine Simple and Complex Logic: As demonstrated in Example 2, mixing direct conditions with grouped conditions allows for sophisticated resource targeting.
- Consider Shared Resources: Example 3 shows how to track shared infrastructure costs that may later need to be allocated across multiple teams.
- Exclude Non-Relevant Resources: Example 2 demonstrates how to exclude development environments to focus on production costs.
Summary
The Databricks Chargeback feature allows you to monitor and allocate costs across your Databricks resources efficiently. With an easy-to-use interface for creating Cost Centers, robust reporting and visualization capabilities, and strict permission controls, this tool is designed to help you optimize resource usage and maintain transparent cost accountability across your organization.
For any issues or further assistance, please refer to the in-app help or contact our support team.